How to Track Google Looker Studio Report Usage with Google Analytics
Data comes packing a vast amount of potential for businesses. The secret to unlocking that potential is acquiring the ability to dig deeper into your data through careful analysis and resourceful tools. Businesses worldwide have a preference for Google’s analytics tools – Google Analytics, Google Looker Studio. However, combining them is the real magic trick you need to master. So, let’s talk about tracking Google Looker Studio Report usage with Google Analytics.
Why Use Google Analytics and Google Looker Studio?
Every platform provides a unique set of benefits to its users, and the same holds true for Google Looker Studio and Google Analytics. Google Analytics provides access to an array of data on user behavior on your website, from bounce rates to time on page. On the other hand, Google Looker Studio enables data exploration, driven by SQL, offering a deeper insight into the context of your business data.
Pairing these two powerful systems is like putting on x-ray specs. You can see straight to the heart of your data, revealing knowledge about your clients and company that may not have been possible before.
Step-by-Step Guide to Integrate Google Analytics with Google Looker Studio
Setting up Google Analytics tracking might sound daunting, but it’s quite straightforward. Let’s walk through the process together, step by step.
1. Kick Off With Google Analytics Account
Your journey with Google Analytics begins by creating an account.
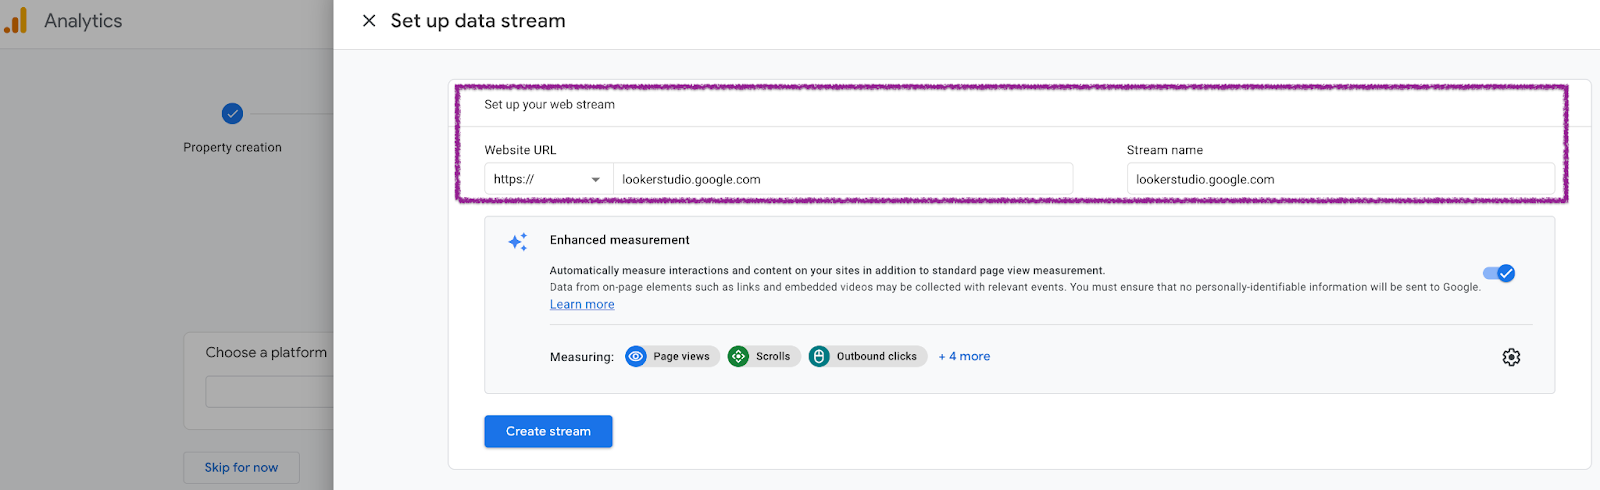
Once the account is set, create your own property. Input the website URL as “lookerstudio.google.com” and voila! You will be handed your tracking ID under the property settings.

2. Incorporate Tracking ID Into Templates
With the tracking ID in your possession, your next stop is the Google Looker Studio Template. Navigate to the dashboard you are keen on tracking. Enter the edit mode and select the ‘report settings’ under the file category. An accommodating sidebar will appear to your right, showcasing a ‘Google Analytics Tracking ID’ section. Paste your previously obtained tracking ID there.

Pro Tip: Repeat these steps for all templates you want to track. For unified data perusal, use the same Tracking ID for all templates. You can segregate the data later using GA view filters or segments.
Once the integration is complete and the events are set up, you will start collecting data on Google Analytics about the usage of your Data Studio reports. You can create an Event Flow report or a user journey, which will give you insights about how users are interacting with your reports. This is a powerful tool as it will help you understand where your reports are getting the most attention, allowing you to focus on what truly matters.
The ability to track Google Data Studio report usage with Google Analytics gives you insights into the performance of your data visualization efforts. This strategy helps complement your efforts and ensures you keep progressing towards your goal in the most efficient way possible. It’s a data-driven world, and the smart use of that data will set you apart!
Happy tracking!