How to Connect Google Analytics 4 (GA4) with Google Looker Studio
Google Analytics 4, the latest version of Google Analytics, offers a host of new features and benefits compared to the previous versions. If you were ever wondering how does Google Looker Studio integrate with Google Analytics 4? We will bring you the answer. This post will show you how to use GA4 with Looker Studio to get the most out of your website analytics. For further customizations of your reports, you can use our Google Analytics 4 dashboard for Looker Studio. Now, dive in and learn how to connect GA4 with Google Looker Studio!
What is Google Looker Studio?
Looker Studio is a free reporting tool that transforms your data into visually appealing and easy-to-understand reports. With Looker Studio, you can create customized reports for yourself or your organization. In addition, reports can be shared with colleagues or customers, and they can be embedded on websites or corporate portals.
Looker Studio also offers a wide range of pre-built connectors, which makes it easy to connect to your favorite data sources. Once connected, you can use Looker Studio’s drag-and-drop interface to build reports without writing code. And if you need a little help getting started, Looker Studio also offers a wealth of resources, including templates, tutorials, and a user community.
Connecting Google Analytics 4 and Google Looker Studio
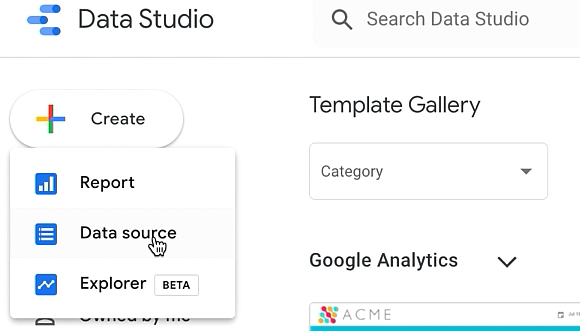
First, you’ll need to connect your GA4 account to Looker Studio. To do this, go to the “Data Sources” page in Looker Studio and click “Add data source.” Then, select “Google Analytics 4” from the list of available data sources.
Next, you’ll be prompted to enter your GA4 account details. Once you’ve done this, you’ll be able to access all of your GA4 data in Looker Studio.
Now that you’ve connected your GA4 account to Looker Studio, you can start creating custom reports and dashboards. To do this, go to the “Reports” page in Looker Studio and click “Create a new report.” Then, select the “Google Analytics 4” data source you created earlier.
You can drag and drop different charts and graphs onto your report canvas. You can customize these charts and graphs to display specific data sets from your GA4 account. For example, you could create a chart showing website traffic by day or night or device type (mobile vs. desktop).
Once you’ve created your report, you can share it with others by clicking the “Share” button in the top-right corner. This will generate a link you can send to anyone who needs access to your report.
Finally, you can also embed your report on a web page or blog post using the provided code snippet.
Connecting GA4 to Looker Studio: Quick Steps
1. Log into your Looker Studio account and click “Create a new report.”
2. Click “Data sources” in the left sidebar.
3. Click the “+ Add new data source” button.
4. Select “Google Analytics 4” from the list of data sources.
5. Give your data source a name and click “ADD.”
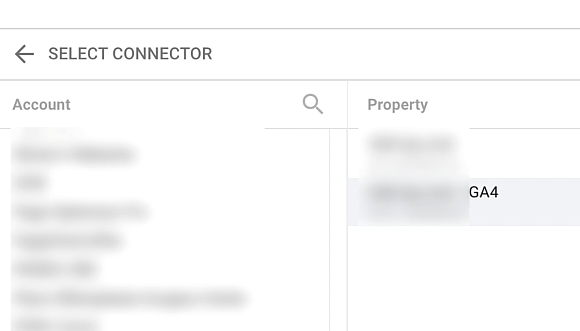
6. Select the GA4 account, property, and view you want to connect to Looker Studio.
7. Click “AUTHORIZE.”
8. Configure the connection settings and click “CONNECT.”
9. Select the GA4 metrics and dimensions you want to include in your report and click “ADD TO REPORT.”
10. Create your report!
Google Analytics 4 (GA4) is the latest version of Google Analytics, and it offers a number of advantages over previous versions—including better integration with Google Looker Studio. In this post, we showed you how to connect GA4 with Looker Studio so that you can start creating custom reports for your website data.
We also showed you how to share these reports with others via the link or embed code. By taking advantage of GA4’s integration with Looker Studio, you can get more insights into your website traffic and better understand your visitors’ behavior. So, try it out today and see how easy it is to transform your data into informative reports!